It’s no secret that VOD services are popular globally. Fortune Business Insights reported in April that the global market for VOD services (valued at $43.9 billion (US) in 2017) is expected to steadily rise each year and land at a valuation of $87.1 billion (US) by 2025’s end. What is next? AVOD (and AVOD analytics).
The Ad-Supported Video On-Demand (AVOD) segment of this market is comprised of companies (for example, YouTube), which rely on paying advertisers to monetarily support their platforms that provide video content or streaming services to end users. Global AVOD revenues are projected to reach $56 billion (US) across 138 countries within the next five years.
Currently, the demand for AVOD services is high in Pacific Asia (particularly China) and in North America, where it’s rapidly escalating. A report released by the TV business intelligence group, Digital TV Research Ltd., suggests that over the next few years, the U.S. will surpass China as the global AVOD market leader, representing more than a third of the AVOD market by 2023.
With the convenience of having readily available Internet access on our mobile devices these days, the fact that mobile advertising has been a chief technological driver of the AVOD market is no big surprise; but, what else can we expect to attribute this AVOD market expansion to in upcoming years?
According to Simon Murray, Owner and Principal Analyst at DTVResearch, “Several large platform launches are expected in the near future in the U.S.” Startups and established media companies have realized that, in order to attract new customers and retain existing ones, they must offer consumers “over-the-top” (OTT) platforms, which deliver video content via the Internet (rather than through cable or satellite).
OTT providers and broadcasters will continue to concern themselves with raising the bar on the quality of their end users’ experience (QoE), as they fight to remain competitive during the global surge of the AVOD market. What will they need to arm themselves with? Analytics – Specifically, they’ll need a robust system capable of tracking and reporting ad experience data.
AVOD survival in a competitive Video on Demand market
As an AVOD service provider, you’re not only competing with other AVODs out there; you’re trying to survive alongside other VOD types that do not rely on ad impressions for business – most notably, Subscription Video On-Demand (SVOD) platforms, the highest consumed of all VOD types across the globe.
Most U.S. households consume SVOD services today, and these consumers are subscribing to an average of three streaming services – behavior that translates to big bucks (approx. $2.1 billion per month collectively by U.S. households). In 2018, OfCom, the UK’s communications industry regulator, reported that SVOD subscriptions in the UK had exceeded subscriptions to traditional TV services. SVOD models have been popular in the VOD business world because their resultant revenues are well predicted from the potential for acquiring subscribing customers to monthly or annual packages.
Netflix, the SVOD platform giant, has expanded beyond the U.S. market, having now collected more than 10 million UK customers and launching across Europe – a viewer base that’s learning what it’s like to consume OTT video content without ads. Case in point is the UK television network, ITV, which has seen an uptick in brand positivity and frequency of viewing among consumers who have switched from Hub, their free ad-supported service, to their SVOD service, Hub+, according to Steve Forde, ITV’s Director of Digital Products and Online Marketing.
Taking notice of the global success of SVODs like Netflix and Hulu may steer the desires of OTTs and broadcasters towards SVOD business models; but, even promising and affordable rising SVOD stars, like the UK’s recently debuted BritBox, aren’t projected to give the dominant SVOD, Netflix, a run for its money.
The VOD business space is still young with ample room for the coexistence of multiple model types to offer various non-linear video streaming experiences. Alongside popular SVOD platforms, particularly in the U.S. market, are AVODs, which are expected to strengthen in popularity over the next few years. Take for example Roku’s free, ad-supported channel known as “The Roku Channel” – now their fastest growing channel in their platform’s history, as reported by Tariq Mahmoud, Director of Roku’s International Advertising Sales and Strategy. Plus, consider all the households in the U.S. and around the globe that still depend on cable or satellite to provide their video watching experiences; they’re ripe for conversion to a hot, new AVOD service.

Common Video KPI challenges that AVOD models face
Building an effective and lasting business model that secures, retains, and grows viewership by relying on ad impressions as its primary monetization strategy isn’t quite a piece of cake.
AVOD survival in the competitive VOD market depends in large part on active monitoring of audience ad tolerance – which challenges AVODs by requiring the continuous management and measurement of the following predominant, ad-related Key Performance Indicators (KPIs):
User engagement is the key!
Do you ever find yourself watching a pre-roll ad, feeling no pressure to click the “Skip Ad” button? That’s what ad-related user engagement data is all about capturing.
You want your viewers to feel like your service offers them a personalized video experience. Accomplishing that goal goes beyond your service’s programming and even includes the relevance, content, and quality of running advertisements.
What do you know about the quality of experience (QoE) provided to your users by the ads you’re running? Which ad campaigns are being skipped the most by users? Which are being clicked? Who is engaging the most with certain ad campaigns?
If users are skipping ads at a high rate or worse, downloading ad-blocker software, you may have user engagement challenges to address further.
User Retention for AVOD
Today, businesses in the VOD space face consumers who demand the best QoE possible. When your users begin to feel like their content viewing experiences are bombarded by ads, or that the playback always buffers or freezes on an ad, they’re going to leave your platform.
Do you have data to support the number of ads you’re running in your AVOD platform? Do you know how much ad view-time you’re losing, due to ads buffering?
Capturing user retention involves an objective consideration for how the number of running advertisements, their quality, and their characteristics (like length and position) affect average view-times of platform content and likelihood of user exits. You will also want to know whether your audience’s ad tolerance is influenced by various other factors, such as the specific programs being watched, ad campaigns run, or device types upon which content is streamed.
New User Attraction
The result of your AVOD service getting a solid handle on user engagement and retention is a return on overall user satisfaction. But your users won’t only think highly of your AVOD platform; they’ll speak highly of it, too. VOD platforms monetized by nonintrusive, targeted advertisements that facilitate a personalized user experience are likely to see a user attraction rate in good shape.
Strategic Planning
When you lack reliable information on the functioning of your AVOD service, planning your next strategic moves can sometimes feel like the blind leading the blind. Which data do you have access to that can facilitate future business decision-making?
For example, are you implementing successful ad strategies that build revenues? Do you wonder if you’re spending money on unnecessary marketing, operational, and technical costs? Do you have any ad-related data that can assist you in structuring your spending budget?

How AVODs Can Employ Ad Analytics to Drive Their KPIs
With the right analytical tools under your belt, there’s no reason why you can’t run a successful AVOD platform in a competitive VOD market.
Ad analytics help you attack your precise KPI data challenges, by providing you access to objective and transparent ad efficiency metrics, which answer your important audience, QoE, and engagement questions. These ad metrics arm you with the ability to run advertisements that are highly targeted to segments of your audience, thereby empowering your AVOD business model with the competitive edge it needs to thrive in a competitive market.
According to Jon Watts, media strategy expert from the European consultancy, MTM, viewers accept the exchange of free content for ad exposure, provided the user experience is good quality. The less intrusive the ads and the smoother the user experience, the higher your user engagement and retention.
Ad analytics, such as buffer ratio and join time metrics, can inform you on whether your audience is receiving rough ad runs. Lowering your ad join time and buffer ratio translates to increasing your platform’s video session playtimes and user retention. Additionally, ad analytics that allow you to analyze these metrics on a finer level, by taking slices of your platform’s audience, can assist you in uncovering categories of users that are experiencing certain ad performance issues.
Ad analytics can also go beyond measuring important performance characteristics, by offering visualizations, such as graphs and charts, which are particularly helpful for gaining clearer perspective on your ad data. For example, you may wish to see a bar graph of the number of ads that are dropped pre- versus mid-roll positioning or a doughnut chart of the average time between an ad starting and being clicked by users.
Ready to improve your strategic planning? Crush your spending uncertainties and get confident about your marketing and operational expenses. With ad analytics at your fingertips, you won’t have to worry about ambiguous spending on potentially shaky ad strategies because you’ll be able to identify which ad strategies are working for you.
NPAW’s YOUBORA Ads
NPAW’s YOUBORA Suite is built for supporting video content providers in their continuous quests to ensure high quality user experience, maintain strong user engagement, and make smart data-driven business decisions.
Of specific relevance to AVODs is YOUBORA Ads, one component application of the Suite that can offer you ad data collected from all major video players that your users are watching from – such as smart TVs, smart phones, web browsers, tablets, and gaming consoles.
If you’re a broadcaster, OTT, or other media company looking for an unparalleled business intelligence solution that offers ad analytics, look no further. YOUBORA Ads tracks, manages, and displays your ad data via real-time monitoring and customizable visualizations.
Real-time monitoring of ad performance
In YOUBORA Ads, you’ll see metrics, such as Ad Errors, Ad Buffer Ratio, Ad Join Time, Ad Skips, Ads Viewed, Ads Clicked (and more), which provide valuable information about ad clarity, consumption, and interaction, in real-time at minute granularity – the best available granularity level for ad data in the business intelligence industry.
The app also houses metrics that provide insights on video session exits that aren’t related to poor ad performance, to further help you discern actual ad quality blips that’ve occurred.
Need insight on the impact of ad length? With the Plays vs. Ad Playtime metric, you’ll learn how many initiated ad plays failed across various ad length categories.
You’ll likely also want to gain an understanding of how ad characteristics affect your users’ consumption of content on your platform. With the Playtime vs. Ad Playtime metric, find out how ad length affects total time users spend watching a video.
Presentation of customizable ad performance visualizations
If you’re a visual learner, you’re in luck. YOUBORA Ads includes an easy-to-use dashboard interface, supported by an extensive selection of widgets, which make the visualization of your ad data possible.
Segment your ad data via filtering any metric of interest by your dimensions of choice – for example, by the ad campaign, viewer country, media content title, position of ad in the video session (pre- or mid-roll), and more. The results are visualizations that lead you to a better understanding of what’s happening in your data and that help you answer your ad-related questions. For example, use filtering to create visualizations that allow you to answer: Which ad position will most likely reduce my number of Ad Skips among gaming console users?
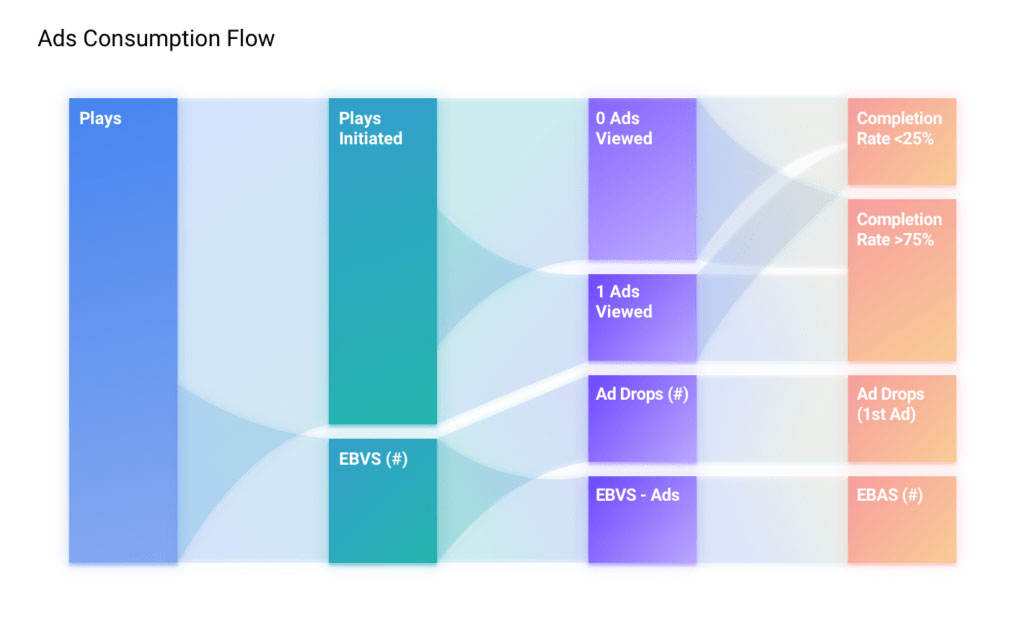
Two popular visualizations offered in Ads are Sankey Charts and Funnel Charts. Use Sankey Charts to visualize ad consumption flow, so that you can better pinpoint where viewers are exiting from video sessions and whether ad exposure affected exiting behaviors. Use Funnel Charts to compare the success of two ad campaigns side-by-side and learn which campaign results in a higher ad tolerance. Dashboards can house your most valued visualizations.
To compete as a VOD business today, you need tools that allow for data-driven decision-making, which leads to higher user satisfaction and ultimately higher business revenues. In implementing and maintaining an AVOD business, you can expect to face recurring hurdles, born from the overarching concern for audience ad tolerance, like sustaining your users’ engagement and loyalty, attracting new users, and planning your next business moves.
NPAW’s YOUBORA Suite offers capabilities that allow you to navigate and solve your VOD business challenges, reduce unjustified costs, and propel your business to success. Within this Suite is the Ads app, which offers businesses access to unmatched insights on the effectiveness of their ad strategies and campaigns and in turn, optimizes their ad-supported monetization model, by empowering AVOD business leaders with a solid control over their audience impact.